

It Started with an Uncomfortable Question
About a year ago, we sat down as a team to ask ourselves a question we had been avoiding. We were growing as a managed cloud provider. We were talking to clients about data sovereignty and security. But when we looked at our own internal infrastructure platform, we found ourselves relying on a patchwork of tools that, if we were honest, did not fully reflect what we were promising our clients.
The monitoring was fragmented. Identity management had gaps. Log retention was not aligned with what CERT-In Directions 2022 actually require when you read them carefully rather than skim them. And several of the tools we were using stored operational data outside India, which is exactly the problem we were helping enterprise clients avoid.
So we made a decision. We would design and build the entire platform ourselves. Not because it is easy. It is not. But because it is the right thing to do, and because the process of building it is teaching us things we could never learn by buying software off a shelf.
This post is not a victory lap. We have not finished. But we have done enough work to share honestly, and we think the journey is worth writing about.
Why We Are Building Rather Than Buying
The obvious question is why not just use SaaS products. There is a managed monitoring tool, a cloud-hosted identity provider, and a vendor-run log management service for every problem we are trying to solve. They are faster to get running and someone else handles the maintenance. The argument for buying is real.
For us, though, three things made that path unworkable.
The first is compliance. We are actively pursuing ISO 27001:2022, ISO 27017:2015, ISO 27018:2019, and ISO 20000-1:2018. We are also building toward MeitY CSP empanelment. And we are reading CERT-In Directions 2022 carefully, including the FAQ clarifications. When you do that, you find that the requirements around log storage, data localisation, and administrative control are narrower than most organisations assume. Logs must be on-premises in India, under Indian administrative control, with no foreign intermediary involved in access. That rules out a whole category of otherwise attractive tools.
The second is future-readiness. We are not pursuing PCI DSS right now, but we have clients in industries where that may become a requirement. So we are designing every part of this platform with PCI DSS controls in mind, even where we are not obligated to satisfy them today. When the time comes, we want to be able to demonstrate compliance through existing architecture rather than emergency remediation.
The third is credibility. We tell clients that sovereign infrastructure, built and operated with care, is better than handing control of critical systems to a foreign cloud vendor. If we cannot demonstrate that in our own house, we are not really equipped to help them do it in theirs.
The Platform We Are Building: Six Stacks
We have organised the platform into six stacks. Each one has a defined scope, a formal architecture document, a step-by-step deployment guide, and a compliance control mapping. Here is where each one stands today.
The DNS Stack: Starting with the Foundation
We started with DNS because everything else depends on it. If name resolution is unreliable, every other system becomes unreliable in ways that are infuriatingly hard to diagnose.
The architecture we settled on uses three nodes with a clear separation between roles. Two Unbound resolvers sit in a VRRP high-availability pair and handle all recursive queries for internal clients. A PowerDNS authoritative server manages our zone data separately. A virtual IP address floats between the two Unbound nodes, so if the primary goes down, the secondary takes over automatically without any client needing to change a setting.
We spent some time debating whether to use BIND or Unbound for the recursive layer. Unbound won because its cache performance is better for our query profile and its configuration surface is smaller, which means fewer places for things to go wrong. It is not the most famous choice, but it is the right one for what we are doing.
One thing we are pleased with: the DNS layer is fully instrumented. Query rates, cache hit rates, NXDOMAIN rates, resolver latency, and VRRP failover events all flow into our monitoring stack in real time. If something starts going wrong with resolution, we will see it in a dashboard before a user calls to report it.
The Monitoring Stack: One Dashboard for Everything
Before we started this programme, our monitoring was fragmented. LibreNMS gave us basic SNMP polling but no storage array visibility, no cloud infrastructure metrics, no log correlation, and very limited alerting integration. Engineers were context- switching between multiple tools to understand what was happening during an incident.
The target we set ourselves was a single Grafana interface that shows everything: border routing, KVM hypervisors, VMware, seven different storage platforms, backup jobs, NTP appliances, hardware security modules, firewalls, power distribution units, and our own management infrastructure. Twenty-two system categories in total, all in one place.
The stack runs as Docker containers on a single dedicated VM. Telegraf handles SNMP polling and NetFlow ingestion from network devices. Prometheus scrapes Prometheus-native exporters from compute, storage, and applications. VictoriaMetrics stores everything for thirteen months, which is significantly more efficient for long-term storage than keeping data in Prometheus itself. Loki collects operational logs. Grafana ties it all together.
At the DR site, a lightweight VMAgent instance scrapes local infrastructure and writes metrics back to the primary VictoriaMetrics over an encrypted WAN link. Both sites appear in the same dashboards, distinguished by a site label. When an engineer opens the storage dashboard, they can filter between primary and DR with one click.
We also designed nineteen dashboards to cover every system category, and we made a rule for ourselves: no dashboard gets created by clicking in the Grafana UI. Every dashboard is a JSON file in version control, provisioned automatically. If the monitoring VM ever needs to be rebuilt, the dashboards come back on their own.
The IAM Stack: An Access Model Without Passwords
We named our identity and access management platform Dvara, from the Sanskrit word for gateway. The name felt right. It is the single point through which every engineer enters every part of our infrastructure.
The design goal we set was absolute: no password should ever travel across the network for backend engineer access. Not at the VPN. Not at the jump server login. Not at the SSH connection to a target host. Not at a management web interface. If a step in the access path requires a password, we consider it a design failure.
Here is how the access path works in practice. An engineer connects from anywhere over a WireGuard VPN tunnel. We are adding a post-quantum pre-shared key to that tunnel, derived using ML-KEM-1024, a lattice-based algorithm that NIST standardised in 2024. The reason for this is the harvest-now decrypt-later threat: an adversary capturing encrypted VPN traffic today could potentially decrypt it years from now if quantum computing advances far enough. Adding a quantum-resistant layer now closes that window.
Once inside the VPN, the engineer connects to a hardened jump server. The login uses pam_u2f. A password prompt never appears. The engineer touches their YubiKey 5C NFC FIPS hardware security key. That is the entire authentication. The account password hash is locked at the OS level. There is no fallback.
From the jump server, SSH connections to target hosts use a PIV certificate stored on the YubiKey in hardware slot 9a. The private key never leaves the device. The YubiKey signs the SSH challenge on-chip, the target host verifies the signature against our SSH Certificate Authority public key, and the connection opens.
For browser-based management interfaces, Keycloak handles authentication through WebAuthn Passwordless. The engineer types their username, the browser presents a WebAuthn challenge, the engineer touches the YubiKey, and they are in. No password field ever appears.
One detail that took us some design effort is the audit trail. Every authentication event logs not just a username but the credential identifier of the specific physical hardware key that was used. We maintain an enrolment registry mapping each key serial number to a named engineer. So any log entry can be traced to one person and one physical device. That chain of evidence is what compliance auditors actually need, and most implementations stop short of providing it completely.
The Log Management Stack: Reading CERT-In Carefully
This is the stack that required the most careful reading before we wrote a single line of architecture. When people say they are CERT-In compliant, they usually mean they have read the headline requirements. We read the full directions, including the FAQ published alongside them, including Q35, which specifies exactly where ICT infrastructure logs must be stored and what "Indian soil" means in practice.
The answer is stricter than most organisations implement. Logs must be on-premises in India, under Indian administrative control, accessible to the CERT-In designated Point of Contact without requiring a foreign vendor's involvement. That rules out cloud-hosted log management products, even those marketed as India-compliant, if the control plane sits outside India.
Our design uses three collection paths. syslog-ng receives TLS-encrypted syslog from network devices, hypervisors, and storage systems. Fluent Bit collects structured logs from Docker containers and Linux management VMs. Wazuh agents run on every host and forward security events to a Wazuh manager.
The storage layer is a native three-node OpenSearch cluster. We made a deliberate choice to use native OpenSearch rather than Wazuh's embedded OpenSearch. The embedded version is tied to whatever OpenSearch version Wazuh bundles. When a security patch is released for OpenSearch, you wait for Wazuh to certify and re-bundle it before you can apply it. With a native cluster, we patch on our own schedule. The independence is worth the configuration effort.
For the cold archive layer, we are using Scality Artesca, an S3-compatible object store that is already part of our infrastructure, configured with S3 Object Lock in compliance mode. Two buckets: one holds operational and audit logs with a 365-day lock, another holds incident-specific log snapshots with a five-year lock. Compliance mode means that even a storage administrator cannot delete an object before its retention period expires. The tamper-evidence is enforced at the storage layer, not just at the policy layer.
The five-year bucket for incident records comes directly from the CERT-In Directions requirement that cybersecurity incident reports must be retained for five years. We wanted that requirement satisfied at a hardware level, not just through a documented deletion policy.
The Alerting Stack: Building Our Own On-Call Platform
For a long time, we assumed that the on-call problem would be solved by a SaaS product. PagerDuty exists. OpsGenie exists. They are mature, well-regarded tools. The problem is that both send alert data to servers outside India, which means incident details, engineer contact information, and operational event data all leave our sovereignty boundary the moment a critical alert fires. That was not acceptable to us.
So we designed our own. The architecture is simpler than it sounds.
Alertmanager sits at the routing layer. When Prometheus fires an alert, Alertmanager groups related alerts together, waits thirty seconds to avoid notification storms, and then routes based on severity. Critical alerts go simultaneously to three places: our on-call scheduling system, a mobile push notification server, and a webhook that creates an incident ticket in our ITSM platform automatically. Warning-level alerts go to email.
The on-call scheduling system is Grafana OnCall, running as a Docker container on our monitoring VM. It manages who is on call, what the escalation policy is, and whether an alert has been acknowledged. If a critical alert goes unacknowledged for fifteen minutes, it escalates to a secondary contact automatically. If that also goes unacknowledged, it reaches the infrastructure lead.
For mobile push notifications, we use ntfy. It is a self-hosted push notification server that requires no Firebase account, no Apple Push Notification Service agreement, and no cloud service of any kind. Engineers install the ntfy mobile app and subscribe to their personal topic over the VPN. The entire notification path from a metric crossing a threshold to an engineer's phone screen stays within our own infrastructure.
The Security Automation Stack: Three Layers of Vulnerability Detection
Vulnerability management at the scale of a managed cloud provider is not something you can handle with periodic manual scans and good intentions. Our asset surface changes constantly. New VMs appear. Firewall rules get updated. Software versions drift. The only way to keep pace is automation.
We designed the security automation stack with three detection layers that operate at different depths and different frequencies.
The first two layers run on Greenbone Community Edition, an open-source vulnerability scanner deployed via Docker Compose on a dedicated VM. We run three scan tiers. Internet-facing services get scanned daily, because the window between a CVE being published and an attacker weaponising it has compressed to hours in recent years. Infrastructure management VLANs get scanned every Sunday night. Tenant workload VLANs get scanned fortnightly, with the scope agreed with each tenant in writing before scanning begins.
All of this scanning is authenticated. The scanner uses dedicated service accounts with carefully scoped read-only privilege on target systems. This matters because a large class of vulnerabilities is only visible from inside a system: misconfigured services, unpatched packages, weak local configurations. A purely external scan shows you what an attacker sees from the internet. An authenticated scan shows you what an attacker who has already gained a foothold sees. Both pictures are necessary.
The third layer is different in kind. Network scanners cannot detect logic-class vulnerabilities in application source code. They cannot find server-side request forgery, path traversal through indirect input, or novel injection patterns that do not correspond to any existing CVE entry, because those vulnerabilities have no network signature to match against. For that category, we are implementing AI-augmented static analysis that traces call chains through source code from user-controllable inputs to sensitive server-side operations. All inference runs on our own GPU infrastructure within the data centre. No code and no finding leaves our environment.
All three layers feed a common findings pipeline. A Python exporter indexes findings to OpenSearch, a lifecycle policy retains them for 365 days, Alertmanager fires on critical and high-severity findings, and a reporting pipeline generates PDF reports that we can hand to auditors or use for internal tracking.
How the Six Stacks Connect
It is worth stepping back to describe what this platform looks like as a whole, because the stacks are not independent products that happen to coexist on the same network. They are designed to feed each other.
The monitoring stack watches the DNS VMs. If a VRRP failover happens on the DNS layer, the monitoring stack captures it, creates a Grafana annotation, and evaluates whether it meets the threshold for an alert. The log management stack receives authentication events from the IAM platform, so every engineer login is indexed in OpenSearch alongside infrastructure events from the same time window. The alerting stack routes findings from the security automation pipeline, so a critical vulnerability finding triggers the same on-call escalation as a storage array going offline. Every piece of information flows through a common pipeline and lands in a common searchable store.
When this is all running, the audit trail it creates is something we are genuinely proud of the design of. If we need to demonstrate that a specific engineer accessed a specific system on a specific date, we can produce the full chain: the WireGuard connection record, the hardware key authentication event at the jump server, the session recording with every command entered, and the sshd log on the target host. Every record is correlated by the same credential identifier, which maps back to one physical hardware key and one named person.
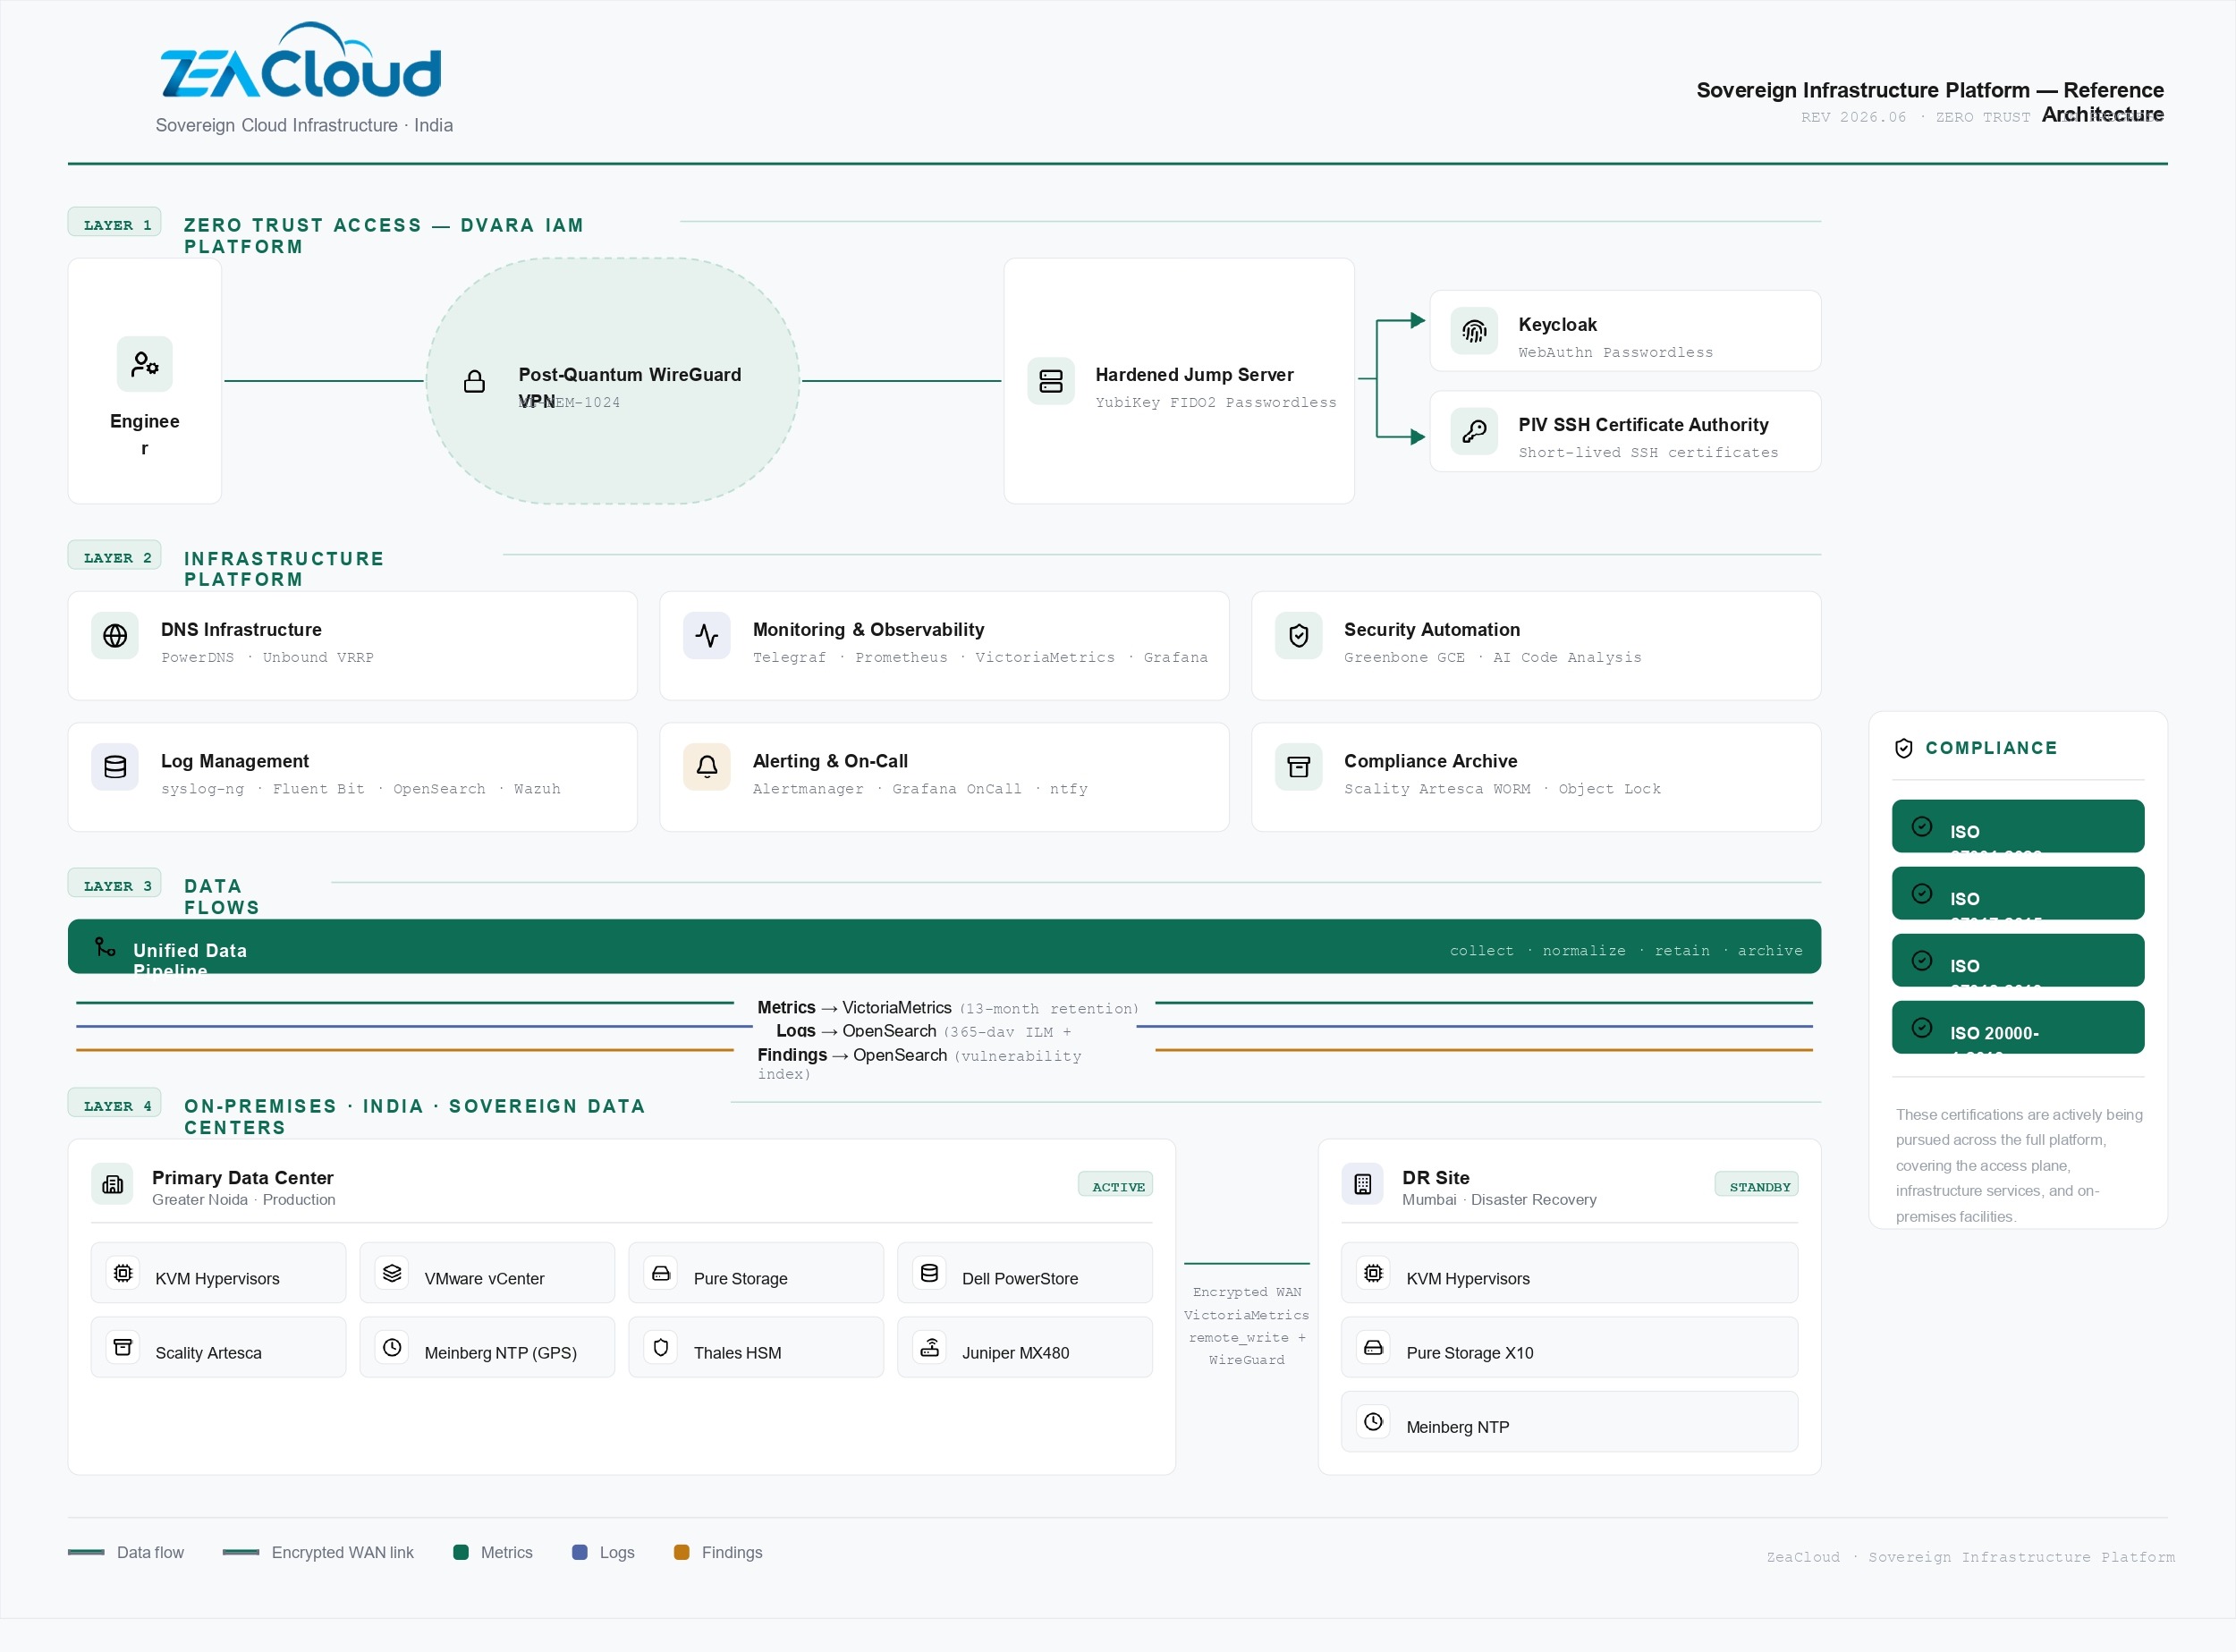
Click on the image to download the PDF version
The Compliance Frameworks We Are Working Toward
We want to be transparent about where we are in the certification process, because we think that honesty matters more than the appearance of having everything sorted.
We are actively pursuing the following certifications. Each of these has a direct mapping to controls in our platform architecture:
We are also designing the platform to be PCI DSS ready. We are not pursuing PCI DSS certification right now, because none of our current clients require it. But we operate in industries where that may change, and we made a deliberate decision to build PCI DSS controls into the architecture from the start rather than face a remediation project later. When the time comes, the design work will already be done.
Each stack has a compliance control mapping that references specific clause numbers in the frameworks above. The documentation is written so that an auditor reviewing any single stack document does not need to reference other documents to understand how compliance requirements are satisfied for that area.
What This Has Taught Us
We would be doing a disservice to anyone considering a similar programme if we only wrote about the architecture and not about what the process of building it has been like.
It is slower than buying SaaS. Every decision that looks simple on a whiteboard turns out to have a complication in implementation. We made architecture choices that we later revised. The decision to use native OpenSearch rather than Wazuh embedded OpenSearch, for example, came after we had already started down the embedded route and realised the upgrade dependency was going to be a long-term operational problem. That cost us time.
But every one of those decisions, including the ones we got wrong the first time, taught us something that sitting in a vendor's sales call would not have. When we tell a client why authenticated scanning finds a different class of vulnerability than unauthenticated scanning, that is not something we read in a white paper. When we explain why we chose VictoriaMetrics over native Prometheus storage for long-term retention, we can describe the actual performance characteristics we observed. When we talk about what CERT-In FAQ Q35 means for log storage architecture, we are speaking from having redesigned our approach after reading it carefully.
That depth is what we think a managed cloud provider owes its clients. Not just the outcome, but the understanding that produced it.
We are going to keep writing about this as it progresses. The next post in this series will go deeper into the IAM stack, including how the post-quantum VPN layer works and what the operational experience of a fully passwordless engineering team actually looks like in practice. If there are specific parts of the architecture you are curious about, or if you are trying to solve a similar problem and want to compare notes, the best place to start that conversation is the link below.
Thinking about sovereign infrastructure for your organisation?
If you are working through Indian data sovereignty requirements, ISO 27001 alignment, or MeitY empanelment and want to compare notes with a team that is going through the same process, we are happy to have that conversation.
Talk to an Architect